
Ramblings
Graphs 101: How to Read Headphone Measurements
A guide to reading frequency response graphs of headphones and IEMs.
Frequency response measurements for In-Ear Monitors
GRAPH COMPARISON TOOL
A guide to reading frequency response graphs of headphones and IEMs.
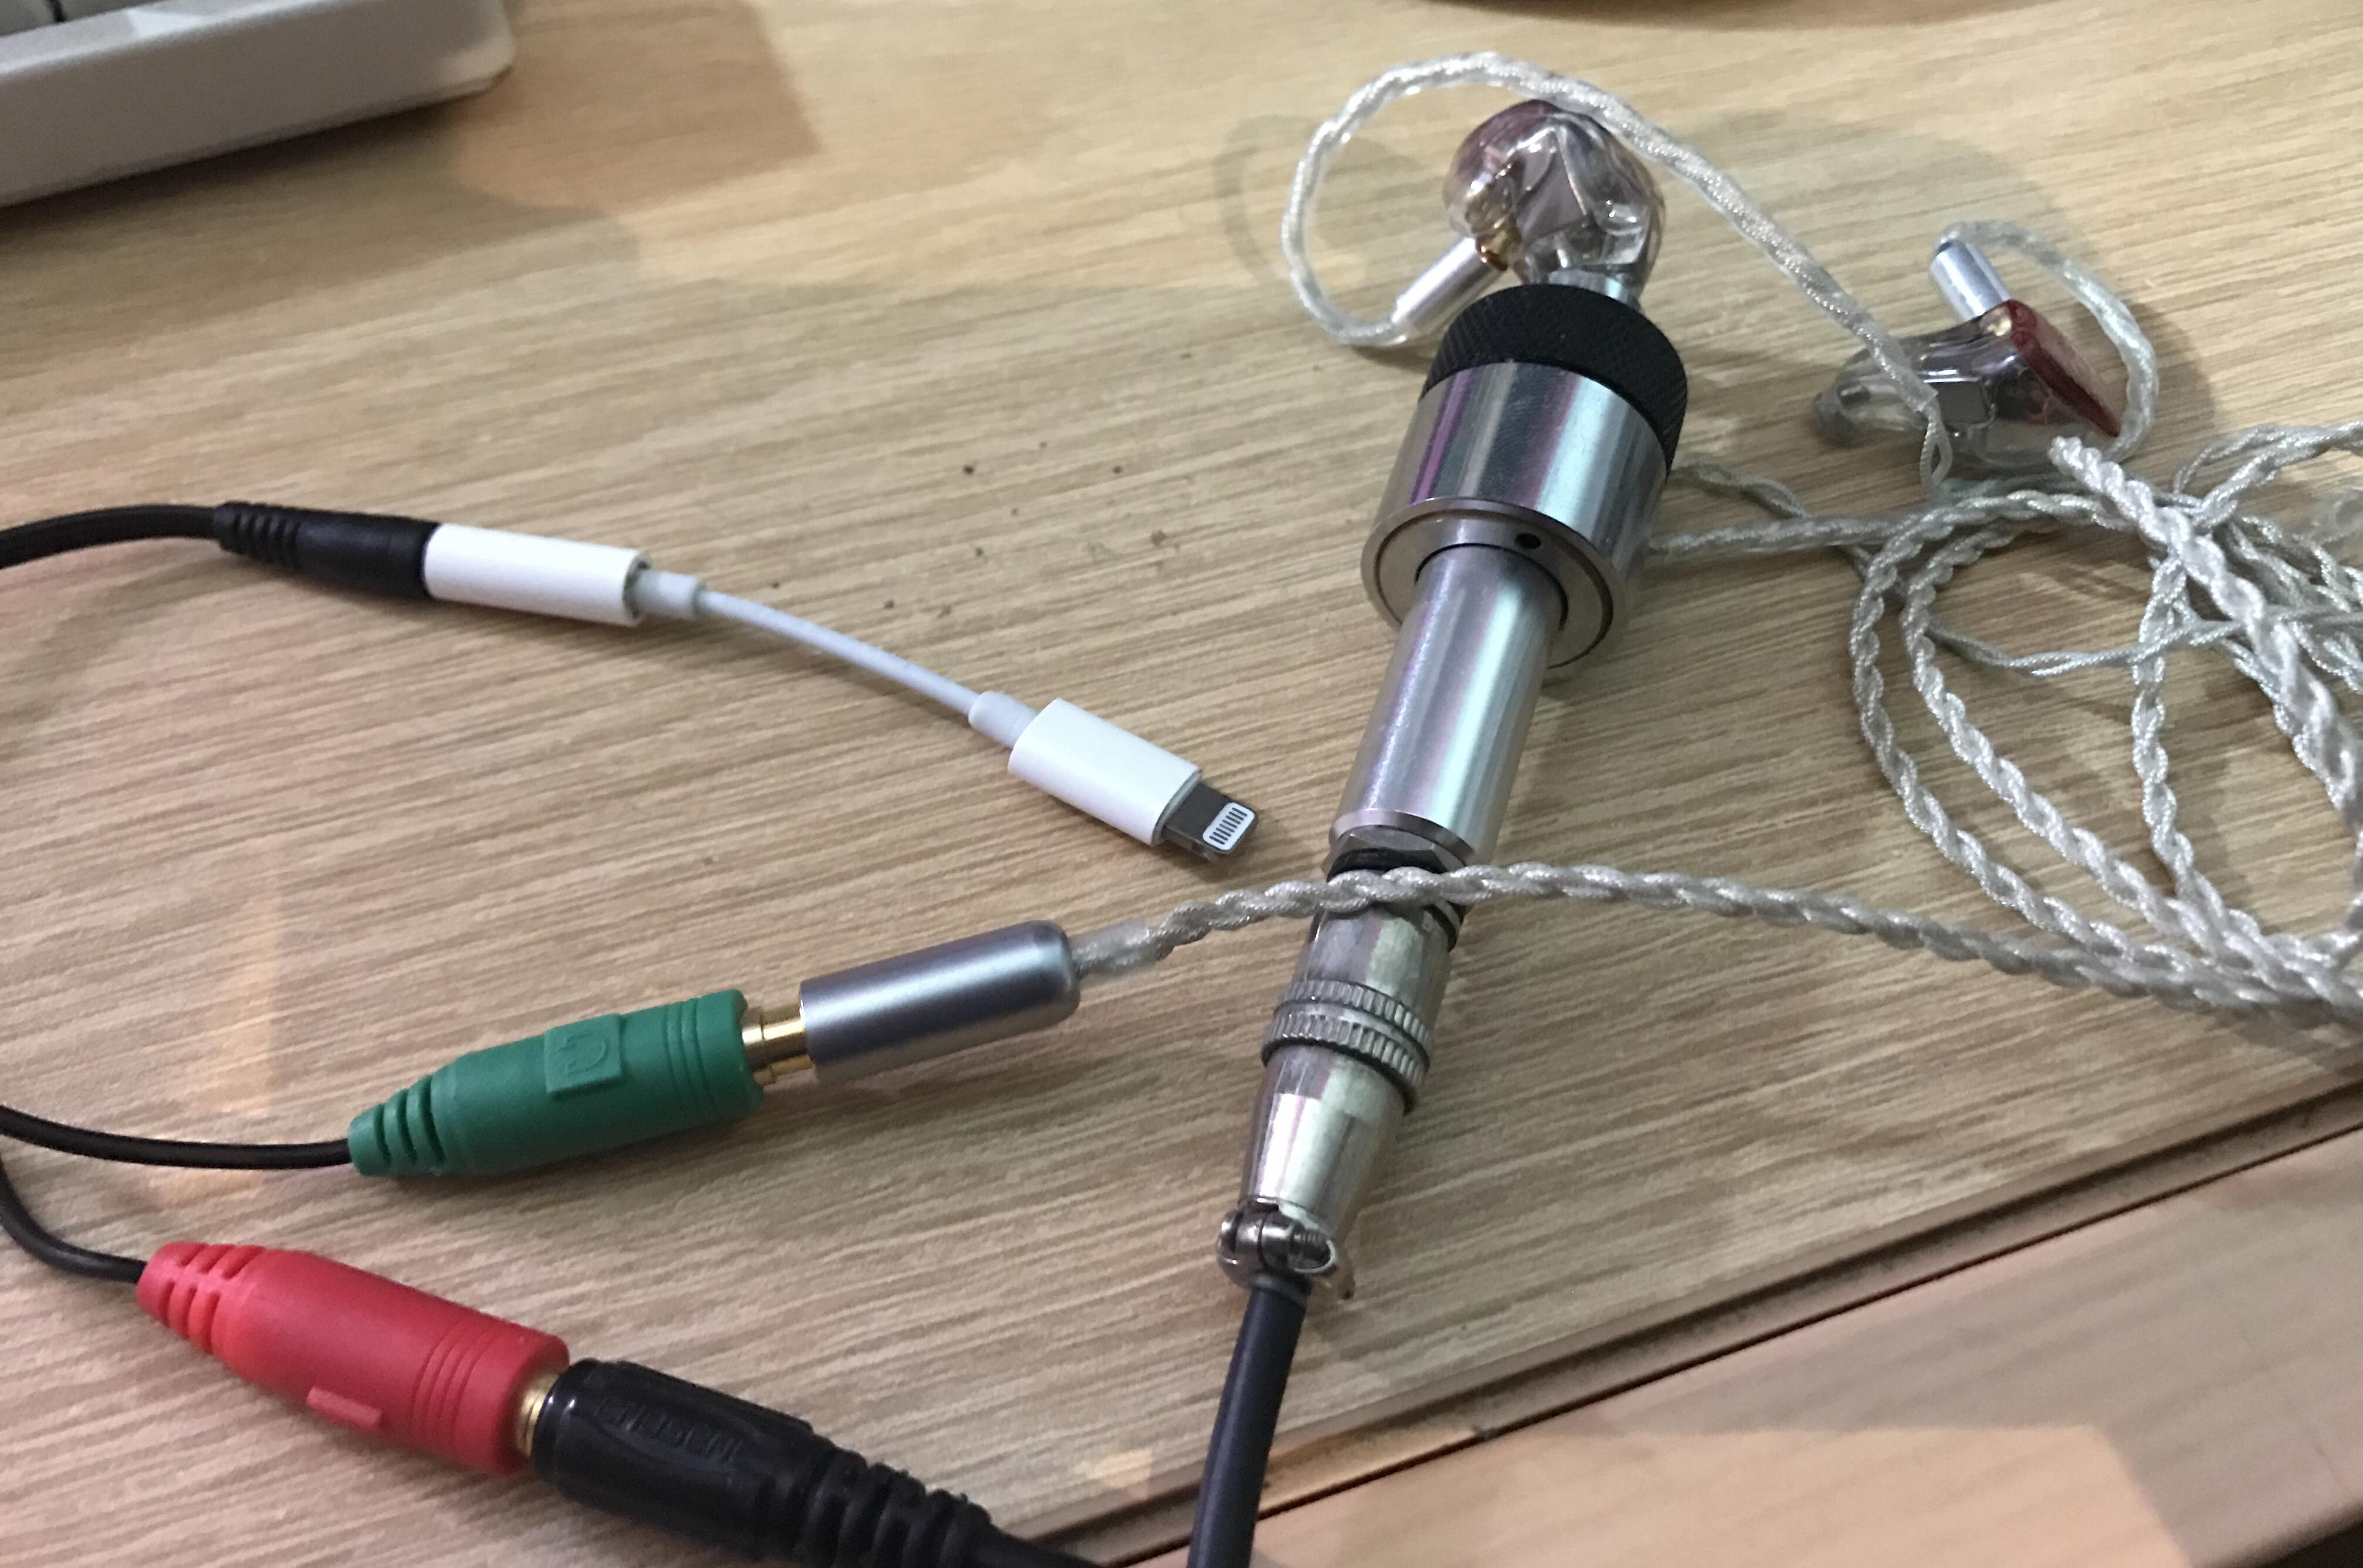
Setup: iPhone dongle (rated at 0.1ohm output impedance) -> TRRS splitter -> high efficiency capsule microphone -> IEC60318-4 compliant inner ear simulator, “AudioTools” app on iOS
With this portable measuring rig, I was able to run around the country to take measurements off demo units. Will be updating this post and the imgur album as I get more and more opportunities to do so in the near future.
Measurements are done on the FFT function of the AudioTools app with the following settings and procedures:
*Note: All IEMs are measured with wide-bore silicone tips unless otherwise stated.
1. A Frequency Response graph is not in any way an indication of good sound quality. Think of it as flavours, like in ice-cream. The FR is like the branding at the side of the tub telling you the flavour of the ice cream. It’s not going to tell you if it’s good ice cream, but at least you have a way of finding out if it’s the flavour you want.
2. Measurements in this database are raw and based on the IEC60318-4 standard. If you are going to compare my measurements with others, at least make sure that both equipment are standardised.
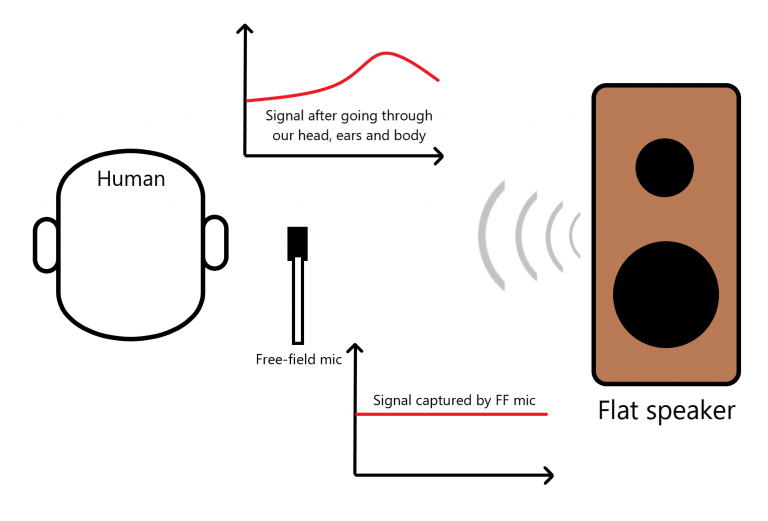
3. Flat on the graph DOES NOT MEAN flat in real life. The fact that IEMs bypass the outer ear structure necessitates higher SPL in the 2-5k regions as compensation (see: Diffuse Field, Head Related Transfer Function, Harman Target).
4. Measurements are meant to complement subjective impressions, not form the basis for them. I get that certain people like to paint me as some sort of objectivehead figure where all I do is look at graphs and determine quality sorely off of said metrics. 99% of the IEMs I’ve measured, I have listened to as well. If not for the graphs, one can also take this database as a list of IEMs I’ve tried and auditioned, and the graphs simply being proof of it.
5. Unit variation is a thing. I do not control what demo units the companies provide to me or to their distributors (where I usually do measurements). If you find issues with my measurements, it can be any of the following:
a) Inconsistent manufacturing
b) Broken/malfunctioning units (in a way that is not immediately obvious)
c) Horrible channel matching
d) Measurement error (yes, I am human, I make mistakes sometimes)
6. Expect a resonant peak. This peak exists around 7-10k and is affected by insert depth. If you are not sure what I’m talking about, don’t try to be smart. Ignore frequencies above 7k until you do.
7. Insert depth for measurements is NOT constant. I attempt to have all measurements performed with a 8000Hz resonance. However, due to the nature of certain IEMs, I may have to use deep inserts to emulate how the IEM should be used (i.e. ER4), or in other cases simply having to work with a shallower fit due to shell constraints (i.e. FitEar demos). As such, the final insert depth/resonance point of each measurement is essentially arbitrary and up to my own discretion.
In-Ear Fidelity is supported by the following:


Support those who support us!
Advertising enquiries